Christmas Carolling Muscle Machine
Project Introduction
This project was completed by Sofia Echavarria and Kidus Zegeye for ECE 4760: Digital Systems Deisgn with Microcontrollers. We completed this project in December 2023 for our final project for this class.
We used surface electromyography, EMG, to measure muscle response through microvolt changes seen when flexing a muscle that fed into a Markov model trained on Christmas music that created instrument melodies influenced by the strength of muscle tension. We wanted to implement this project because of our interest in human-interaction with technology and sensors to create art, in this case music.
High-Level Design
Background
For our signal conditioning system from the electrode input, we used two sources primarily to look at example systems that worked previously in conditioning electrode input: Bruce Land's Physiological AC Preamplifier and a DIY muscle sensor/EMG circuit for an Arduino designed by Advancer Technologies. In Bruce's physiological amplifier, he utilized a passive lowpass filter with the incoming electrode input then passed it through an INA121 differential amplifier (to determine the voltage difference between the two working electrodes) then passed it through a highpass filter, and finally an LM358 opamp to amplify the signal. Then Bruce adjusted the highpass and lowpass filter based on the type of physiological sensor being used. In addition, Bruce split a 9V battery so there was a +/- 4.5V line in addition to the ground line. The DIY muscle sensor circuit utilized an INA106 to determine the difference between the two working electrodes, then passed the signal through three TL072 dual-op amps to amplify, smooth, and rectify the signal. This circuit was powered by two 9V batteries with a +/- 9V rail.
Overall Design
In the program, we use two Markov models to determine what note is played and the length of the note. These Markov models allow us to stochastically determine the next value based on the previously selected value. Each value, be it a note or a note length, has a set of transition probabilities for each subsequent value from it. In this project, we went through a list of Christmas songs and counted up the frequencies of note transitions and note length transitions, which we used to create our probability distributions for each note/note length. With this, we were able to bias our model to choose notes and note lengths that sound somewhat Christmasy, to fit the season.
Then, we integrated the voltage measurements from the arm's muscle responses to bias the probabilities based on the magnitude of the muscle voltage. Since the notes we chose are in order of increasing pitch, and the note lengths are in order of decreasing length, larger values of muscle voltage will create higher-pitched, fast-paced songs. In addition to this, we also increase the tempo of the music with the measured voltage, causing the music to be increasingly frenetic as your arm is flexing. To add to the Christmas cheer, we used FM synthesis to modulate the sounds played for each note, which mimics different musical instruments. These instruments include plucked strings, drums, snares, chimes, and more. To allow the user to play with the different instruments when making their song, we included the ability to change the instrument via a keypad.
Hardware Design
Bio Instrumentation Circuit
For our hardware design, we were influenced by many sources to come up with our design and testing strategy.
First, we started with a three-electrode setup to measure the muscle voltage changes effectively. This is a traditional surface electrode setup to use three different electrodes as ground, and two as the testing voltage difference inputs. We determined that this would be the most effective system after talking with Bruce Land about our overall goals and development ideas.
Then, based on multiple experiments conducted by other researchers (see references) we came up with a plan for making our signal conditioning system. The surface electrodes pick up EMG signals in the millivolt range and we wanted to determine the difference between the two working electrodes using the ground electrode as a reference. Then we needed to amplify and condition the signal so that the RP2040 could understand it later.
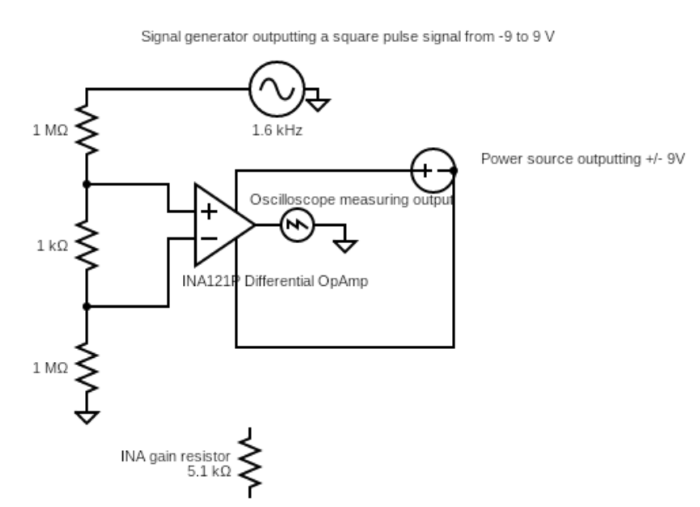
Using the two examples described in our background as starting points for our hardware, we worked with Bruce Land to come up with a good testing method using the oscilloscope and function generator before hooking it up to the electrodes and isolating the system. To simulate our EMG biological input of a few mV pulsing, we set the function generator to output a 1V sine wave and sent it through a voltage divider to have a 0.01 mV sine wave coming into our first opamp, the INA121. We decided to use the INA121 because it is a standard differential op amp that also has an amplification component so we figured it would be effective to determine the difference between the working electrodes. We also decided to power our system with the lab DC power source with a +/- 9V rail and a common ground. Then, to configure the INA121, we had to connect the positive and negative inputs from our voltage divider into the opamp, connect our +/- 9V rail to the V+ and V- components, add a reference ground which was connected to the power supply ground and function generator ground and include a gain resistor. We determined that a gain of 10 would be sufficient since we didn't want to amplify too much noise since we were not filtering the input signal before putting it in the opamp. To implement the gain of 10, we utilized a 5.1 kOhm resistor. Finally, to test that our opamp was working, we connected the oscilloscope to the output and measured it to ensure that it was conditioning the signal as expected. For our .01 mV sine wave input, we expected the output of the op-amp to look like a sine wave with an amplitude of around 0.1 mV because of the gain of 10. Below is a diagram of our first tester circuit as described above.
When testing this first circuit, there were a couple of issues we ran into. First, we were getting strange outputs because the ground we connected to the op-amp was not connected throughout all the devices. In addition, when we were looking at the sine wave on the oscilloscope, there was a good amount of noise making the signal look fuzzy. To try to reduce the noise we were seeing, we wanted to implement a bandpass filter in our signal conditioning stage.
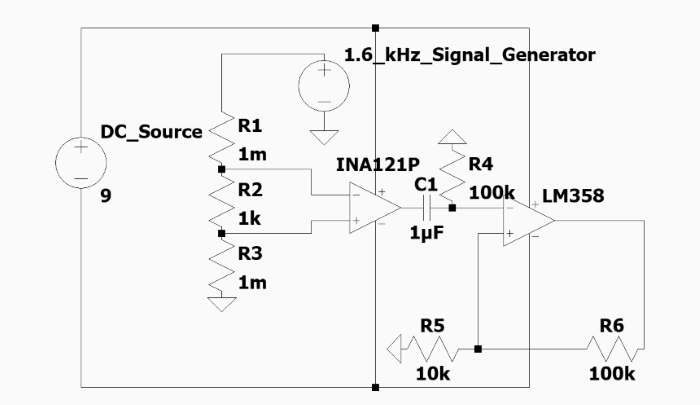
To start, we implemented a highpass filter after the INA 121 to try to remove some of the noise getting picked up from the signal acquisition. We utilized a capacitor-resistor combination to make a high-pass filter before passing it to our next op-amp, dual op-amp LM358. We used a 1 uF capacitor and 100 kOhm resistor to filter the lower frequency noise. Then we inputted the filtered output into the next op amp, an LM258 dual op-amp with 100 gain. We wanted to do 100 gain to have a system with 1000 gain overall to get it in the effective voltage range instead of 100 gain overall. We tested the system using the same method but with the oscilloscope at the output of the second op-amp.The circuit we tested is included in the figure below.
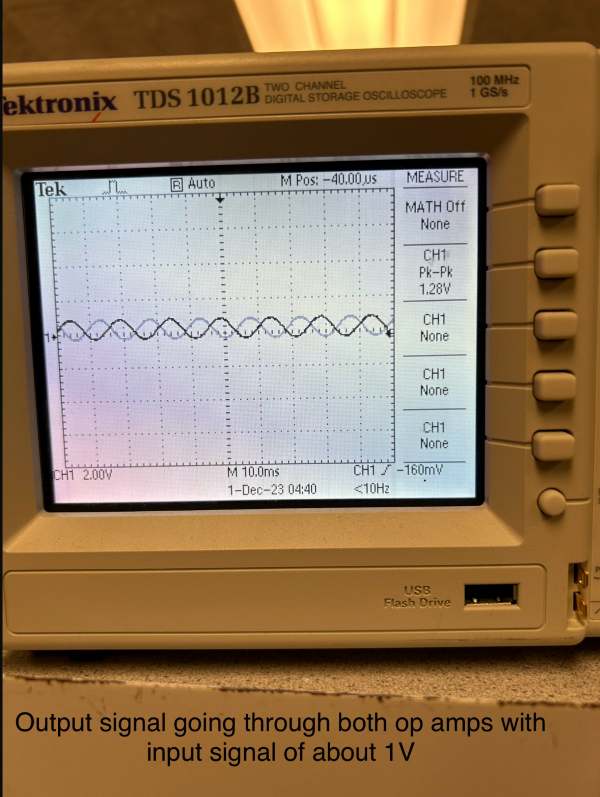
The outputted waveform was in the 1V range since our system had a gain of 1000 at this point. The waveform outputted by the oscilloscope can be seen below.
The next step in our hardware design was to implement the electrode system and give the system a floating ground to make it safe for testing on humans. We went through some trial and error to determine how to best read the signal being outputted by the signal conditioning system. We couldn't use the VGA, lab oscilloscope, lab monitors, or anything connected directly to ground.
First, we connected the system to Sofia's laptop using an audio jack connected to an audio adapter. Then we put the input into an oscilloscope app. We tested flexing our muscles with that system but the oscilloscope output was very sensitive to audio noise like clapping our hands near the speaker and it was unclear if the input from the electrodes was really working.
So we pivoted to using a mini oscilloscope LCD device given to us by Bruce Land. Once we wired the system to that device, it seemed to be working better but still had a lot of noise. Because it seemed to have a lot of distortion on a pretty large scale, we dropped the circuit gain on the second op-amp to just 10 instead of 100. This made our overall system have a gain of 100 instead of 1000. While we were testing it, we also saw a lot of extra noise added when we tried to plug it into the RP2040 GPIO 26 which is an ADC (analog to digital) input. After a lot of searching, we found that the source of the noise was that the system was not properly grounded throughout. This happened because we were using one of the breadboards that had a split connection in the middle rails so our ground rail was not connected all the way through. Another issue we saw was that there wasn't enough of a signal coming through unless we had really big muscle contractions. When we removed the low-pass filter, it fixed this issue and the signal got through. After we fixed this grounding issue and high-pass filter issue our electrodes were outputting expected signals but we did see that we needed to strategically place the electrode pads on large muscles to pick up the best signal spikes.
To connect the electrode output to the RP2040 for use in the Markov model, we connected it with GPIO 26 which we configured as an ADC input. This helps take in the analog signals being outputted by the electrodes and our signal conditioning circuit and converting it to digital signals the RP2040 can process. We used this information in the Markov model as described in the program design.
Audio Circuit
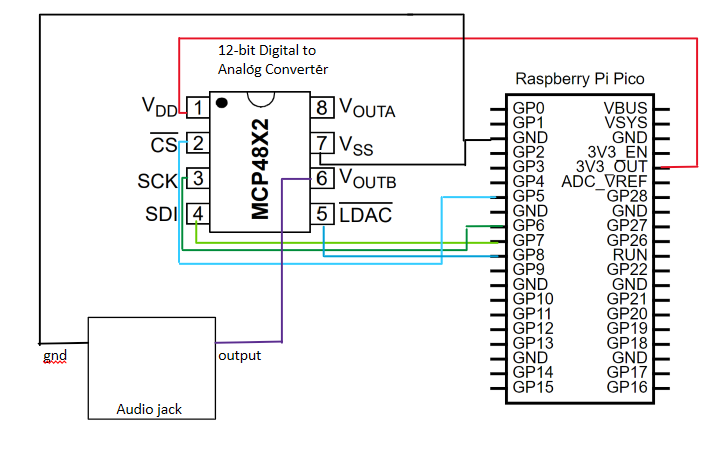
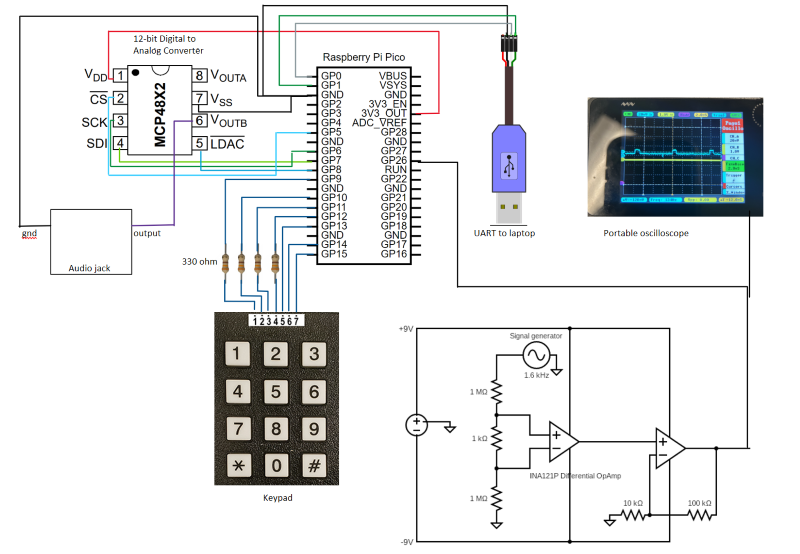
To make our audio circuit, first, we looked at how the MCP4822 Digital-to-Analog Converter works and how to integrate the pin-out with our Pico microcontroller. The DAC is a 12-bit analog-to-digital converter that is compatible with any 2.7V to 5.5V supply with Serial Peripheral Interface (SPI). Since the Pico is 3.3V powered, we connected the Vdd pin on the DAC to the 3.3V output pin on the Pico. The CS pin is the chip select input which we connected to the GPIO5 pin which we configured as an active-low pin to enable serial clock and data functions which is part of the PSI channel in the GPIO definition section of our code and in the main() section of the code (see Figure 2 below). The SCK pin on the DAC controls the Serial Clock Input which we connected to the GPIO6 pin which we configured as part of the SPI channel below. The SDI pin on the DAC controls Serial Data Input which we connected to the GPIO7 pin which we configured as part of the SPI channel below. We have a configured MISO GPIO pin for the SPI channel on the Pico to work but we do not connect it to our DAC because it does not have the functionality to communicate from the DAC to the Pico. We only need the communication from the Pico to the DAC so we only utilize the MOSI GPIO pin.
The Vss pin is the ground pin for the DAC so we connect that to one of the GND pins on the Pico. The LDAC pin on the DAC is the synchronization input that transfers the DAC settings to the VOUTB which we connected to GPIO8 on the Pico. The LDAC is set as a GPIO output pin on the Pico that is held low to update both VOUTA and VOUTB so either can be utilized.
Finally, we had to connect the VOUTB to the audio jack that will connect to the speaker. The configuration of these analog output pins is configured in our code and sent to the DAC through the LDAC pin. For our system, we utilized the VOUTB pin to output the correct voltage to configure for the correct frequency. The Markov model code would tell the DAC what note and at what frequency to output it using the FM synthesizer code. Then the output of the DAC was connected to an audio jack connected to a speaker to effectively produce sounds when the RP2040 asks. The circuit can be seen below.
Keypad Circuit
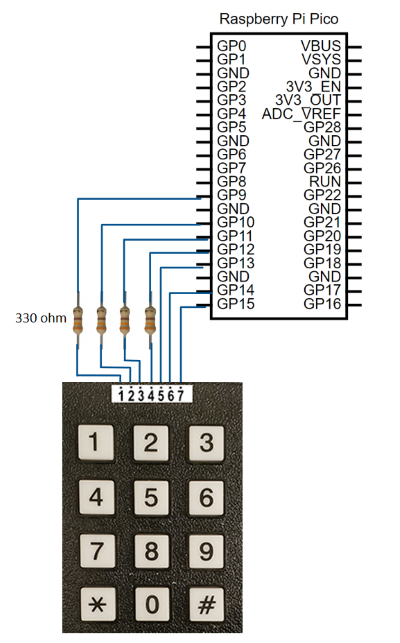
For the keypad circuit, we used a 12-button keypad that we configured to the RP2040 to change instruments when pressing the different buttons within 1-8.
For the 3x4 matrix keypad, it had 7 pinouts with 4 being connected to each row and 3 being connected to each column. When we pressed a key, this would short one of the row pins and one of the column pins to demonstrate to the Pico which key was pressed. To make the shorting process easy for the Pico to read, we initialized the row pins to be GPIO outputs and the column pins to be GPIO inputs. To reduce any floating issues where the input or output pins are stuck in between states (on or off), we have to implement pull-up resistors (330 ohms as seen in hardware diagram) for the GPIO outputs and pull-down resistors, which are internal within the Pico, for the GPIO inputs. This helps all the GPIO pins be either 0 or 1 and not get stuck in the in-between.
We define the first GPIO keypad pin (GPIO9), the number of rows, and the number of keys for the scanning function. In the main() of our program, we initialize GPIOs 9, 10, 11, and 12 as outputs and GPIOs 13, 14, and 15 as inputs. We also turn on the internal pulldown resistors for the input pins as described above.
Program Design
Markov Model Program
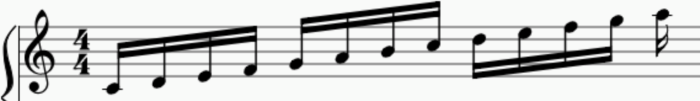
We implemented two Markov models, one for choosing notes and one for choosing note lengths. The notes that the program can choose from range from middle C to A5. This range includes sharp notes as well, including A5 sharp. We chose this range because we wanted to stay in the treble clef and this range encompassed all of the notes we encountered in our music sheet training data. We store these notes as an array of 23 frequencies in Hz, sorted from lowest to highest. The note lengths that are available range from sixteenth notes to full notes, including dotted quarter notes and dotted half notes. We store these note lengths as an array of integers: 16, 12, 8, 6, 4, 2, 1. These represent the lengths as multipliers of sixteenth notes, so 16 represents a full note, 12 represents a dotted half note, 8 represents a half note, 6 represents a dotted quarter note, and so on. These are sorted from longest to shortest length.
These Markov models are represented as matrices with probabilities for their entries. Each row represents a note/length, and each value on the row represents the probability of transitioning from the row's note/length to the column's note/length. In practice, we actually used matrices of the same row/column structure but instead stored cumulative probabilities (that sum to 1) for each row so that we could use an input value (in our project's case, the readings from the electrodes on the arm), normalize the value to be less than or equal to 1, and then see which note/length the model will transition to next.
The code for running our Markov model is in a protothread that runs whenever a sound is not playing. When choosing our initial current note and current note length, we pick a random note and random note length. From there, we start an infinite while loop for the Markov models to run, playing a note for each iteration. We did this by looping through each entry of the current note/length row in the matrix and selecting the first transition that had a cumulative probability greater than the normalized input value. This would mean the input value fell into this transition's "bucket," and more common transitions would have larger "buckets" than less common ones. Once we found our next note and our next note length using this method, we played the sound and set the note/length that was played to be the current note/length. We then repeat the outer while loop to continue choosing another note/length. In order to populate the probabilities in these matrices, we counted the notes and note lengths in Christmas songs and normalized them using two Python scripts, note_agg.py and length_agg.py. The songs used were O Holy Night, Silent Night, Jingle Bells, 12 Days of Christmas (up to the fifth day), Deck the Halls with Boughs of Holly, Hark the Herald Angels Sing, Ring the Bells, I Heard the Bells on Christmas Day, and The Nutcracker March. The Python scripts we made take in notes or note length values via terminal input, and keep track of the amount of transitions. Once complete, it generates a matrix of probabilities and a matrix of cumulative probabilities that we were able to copy into our C code.
FM Synthesis
To play the sound characterized by the note and length chosen by the Markov model, we used FM Synthesis. We decided to use FM Synthesis to play sounds rather than just using sine tables because FM Synthesis allows us to modulate the frequency of the sound, making it possible to mimic the sound of instruments. We used Bruce Land's FM Synthesis code from here.
The FM Synthesis code runs on a repeating timer ISR that plays a portion of a sound every 50 microseconds. In the Markov model protothread, the protothread yields until tempo_v1_flag==1. This occurs when the sound being played ends. Once the sound ends, the Markov model protothread would setup variables for the ISR to play the note with the given note length, and then set play_trigger=1 and tempo_v1_flag=0. Like in lab 1, the FM Synthesis code utilizes a sine table that it indexes into via an incrementing index. Based on this index, we can change the frequency of the sound to be the sound of the chosen note. Via the array of note frequencies, we are able to take our chosen frequency and multiply it with the instrument's synth frequency and 2^32 divided by the sampling frequency (4000 Hz) to get our phase increment. This was fairly simple to implement, as it was just replacing a value in the FM Synthesis code. However, implementing note lengths was trickier.
Sounds played by the ISR only ended when tempo_v1_count became greater than the tempo. This would indicate that a different note would need to be played. At first, when trying to change the note length, we tried multiplying anything from the attack, decay, and envelope variables in an attempt to elongate the sound's envelope for longer note lengths. However, we realized that notes of different lengths don't have to have different attack or decay rates. Instead, we considered the current sound envelope to be a "full note." If the note is shorter than a full note, we would cut it off early by modifying the tempo variable by the current note length. Instead of dividing the tempo, we assumed that the current tempo would be the length of a sixteenth note, and multiplied it by the note length instead. This is why we made the note length values integer multipliers of a sixteenth note. This was successful in making the note lengths apply to the played sound.
One additional thing we did was modify the temp based on the voltage measurements of the arm. This would make larger arm voltage readings increase the tempo, causing notes to play faster. The tempo variable is an integer in terms of ISR ticks. To increase the tempo, we decrease the value of this integer so that it takes fewer ISR ticks to finish a note. So we subtract a base tempo of 5000 ISR ticks by the voltage reading from the arm (normalized to 1) times 1500. We felt that this made the change in tempo very noticeable but not too hard to manage when flexing.
Arm Voltage Reading
We use the RP2040's onboard ADC to get the voltage input from the bio instrumentation circuit. The output values range from 0 to 4096, which has the side effect of not measuring negative voltage readings which do get read by the oscilloscope. While we could have built a voltage rectifier, so that the voltage readings from the arm are always positive and the RP2040 would thus read more signals from the arm, we did not do so. This is due to time constraints and the lack of value, as we are able to get a readable signal from the ADC only using the positive voltage inputs.
One tricky issue was determining the method of reading the input from the ADC. The voltage measurements from the electrodes tend to spike and fall instantaneously when the arm is flexed. This means that when using voltage readings for choosing the transition for the Markov model, we can't just take a measurement when we need to play a note. If we did this, it would be difficult to get higher voltage values as input for the Markov model because the user would have to time the arm movement the instant the RP2040 takes the measurement.
Instead of using the raw ADC input value, we instead made a protothread that polled the ADC every millisecond. We then divide it by 4096, and add it to a variable called integral_sum. This builds the value of intergal_sum if a user is flexing their muscle repeatedly, like they are charging a battery. After adding to integral_sum, we decrease the value of integral_sum by 0.1%, so that the value can wean off over time if the muscle is not flexed. To remove noise from the ADC input, we only add to integral_sum if the ADC input is greater than 1000. We also clamp the integral_sum variable to be at integral_size=5 at most. We chose a number greater than 1 for the size so that the intergal_sum won't be maxed out by one strong flex. For example, if the muscle flexing maxes out the ADC input at 4096, it will only add 1 to the integral_sum, which would be only 1/5 of the integral_sum's capacity if integral_size==5.
When we use integral_sum in the Markov model protothread, we divide it by integral_size so that it is normalized to 1, and we can use that value in our cumulative distribution functions in a row of a Markov model.
Keypad Program
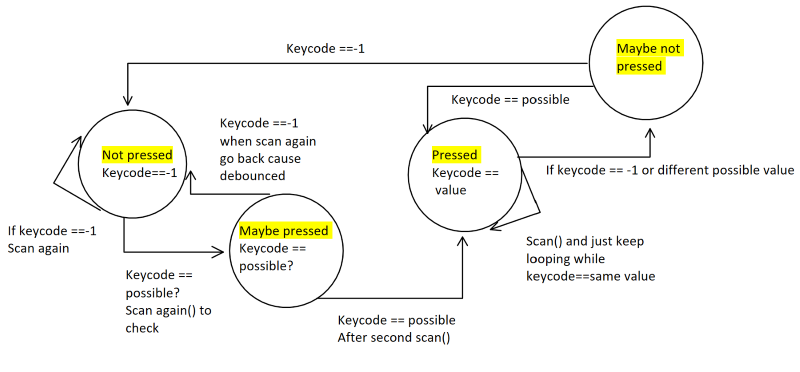
To implement button pressing, we had to use a finite state machine after scanning the keypad to ensure that for each button press, there is a change in instrument and that the microcontroller doesn’t detect multiple button presses each time you press or release a button. To prevent this, after each keypad scan was implemented, we check the state of the button pressing and see if we need to change states. We start in the not-pressed state and repeatedly scan the keypad for anything that is not a -1. If anything is returned on the i-value, then the state machine goes to the maybe-pressed state. After the thread scans the keypad again, if the possible value is the same as the i-value then it should transition into the pressed button state. In this transition, it will set the beeping to 1 which will enable the sound to be produced in the ISR. If the i-value doesn’t equal the possible value then it goes back to the not pressed state. During the transition from the maybe-pressed state to the pressed state, we change the instrument to the specified i-value if it is between 1-8. Once in the pressed state, if the i-value doesn’t equal the possible value when it moved to the pressed state then another button might be pressed or the current button was released and it moves to the maybe-not pressed state. Until either of those actions happen, it will remain in the pressed state. Finally, in the maybe-not pressed state if the i-value is just the same possible value then it should go back to the pressed state since the button wasn’t actually released. If any other i-value is returned, then it should go to the not pressed state. This finite state machine can be seen in the image below.
Results of the Design
Our final system included three electrodes connected to someone's skin (in our demonstration video it's Kidus) that creates a caroling beat that speeds up and goes higher when the user flexes their muscles. In addition, the user can change the instrument type using the keypad.
Final Hardware Diagram
Safety
Since our project uses human testing, we had to be very careful with our system. To ensure we were safe, when we connected the electrodes to our skin, we needed the system to be connected to a floating ground as a regular grounded system could cause us to get electrocuted.
Usability
The usability of the project depends on the build of the person who is using it and the quality of the electrode connections. The amount of fat or muscle in the arm and the specific muscle being measured can affect the voltage reading. However, using high-quality electrode pads was a very important factor for reading stronger voltage measurements. The differences introduced by these factors can make getting a voltage reading that causes a meaningful change in the audio harder for some people than others.
Conclusions
For the hardware design, we would make some changes to make our system more reliable. We would have liked to include a signal rectifier op-amp to rectify the signal since we found that sometimes the signal would spike with a muscle contraction and then go below 0. To be able to gather all the data from the muscle contraction, I would have liked to include a rectifier but it would only increase the resulting system's effectivity a little bit.
References
EMG Circuit Advancer Technologies
Sheet Music Training Data: