Woodchip Bioreactor Engineering Research
A report of our research was published in the American Chemical Society on March 22nd, 2024. Here is the article link. Here is the pdf of the published report.
I wrote the following report after working on the project full-time over the summer 2022, about my contributions and work with the digital automation of the bioreactor. I translated it into the webpage below. This report was written on 09/15/2022.
Real-time Control of Woodchip Bioreactors to Overcome Carbon-Limited Conditions and Boost Denitrification
Sofia Echavarria1, Zihao Zhang2, Yi Sang2, Scott Steinschneider3, Nils Napp1, and Matthew Reid2
1Electrical and Computer Engineering, Cornell University, Ithaca, New York
2Civil and Environmental Engineering, Cornell University, Ithaca, New York
3Biological and Environmental Engineering, Cornell University, Ithaca, New York
Abstract
Agricultural systems need to increase food production to feed a growing population while mitigating the negative impacts of nitrogen fertilizers on water and climate. Nitrogen runoff from agriculture can increase greenhouse gas emissions, dead zones in coastal areas and estuaries, and damages to the ozone layer. To combat this issue, we are developing an autonomous woodchip bioreactor that increases nitrate (NO_3^-) removal by overcoming limitations to denitrifying microbial metabolisms while utilizing IoT technology and feedback control to optimize performance. Woodchip bioreactors are sustainable, cost-effective technologies that utilize wood biomass as a source for denitrifying organisms. Having IoT capabilities will help farmers regulate conditions inside the bioreactor to promote the release of bioavailable carbon for denitrifying microbes. We began this process by testing, calibrating and deploying a Campbell Scientific datalogger with two analog oxygen sensors, a redox sensor, an SDI-12 nitrogen sensor, two SDI-12 pressure transducers and solar panels with a battery. SDI-12 is the communication protocol for intelligent sensors that monitor environmental data. Then we setup the ISSCO samplers to gather spot water measurements from the bioreactor every 6 hours. Next, I led the development and implementation of the IoT technology for the data logger so we could gather real time data from the field site. The system utilized the IoT capabilities and range of sensors to pump carbon (acetate) into the bioreactor triggered by certain conditions including high nitrate levels (read by the SDI-12 nitrate sensor), low oxygen levels (read by analog oxygen sensors), high-water levels (read by SDI-12 pressure transducers) and severe weather events (reported through IoT module). To create an accessible, easy-to-uptake technology, I am leading the effort to transition to an Arduino microcontroller with a Sparkfun IoT chip, SDI-12 sensors and analog sensors. After the Campbell Scientific system was installed, we conducted a few experiments pumping acetate and bromide into the reactor. Whenever high amounts of bromide and/or acetate reached the bioreactor the nitrate plummeted down acting as a proof of concept that carbon pumping does help make the system more effective.
1. Introduction
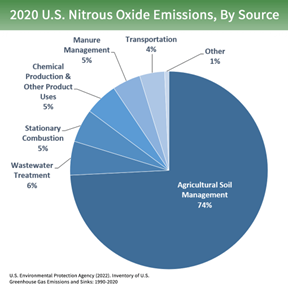
Nitrous oxide is a powerful greenhouse gas that has approximately 265 times the global warming potential of carbon dioxide (Tian, 300). Agriculture is the largest anthropogenic source of N₂O emissions accounting for about 60% of the total anthropogenic emissions as seen in the pie chart below (EPA, 2). This is mainly due to the widespread use of nitrogenous fertilizers that contribute to nitrogen oxide leaching and runoff into bodies of water. The nitrogen runoff can lead to excess nitrogen in groundwater which can increase greenhouse gas emissions, acidification of soils and water bodies, dead zones in coastal areas and estuaries and damages to the ozone layer. In addition, less than half of the nitrogen fertilizer added on corn is harvested with the grain which results in potential leaching and contamination of nitrate N into downstream water bodies (Roser, 856).
Denitrifying bioreactors offer many advantages as a way to reduce nitrogen output for agriculture since they do not take land out of crop production (since they are underground) and are cost effective compared to other mitigation strategies (Roser, 856). A woodchip bioreactor is a closed anaerobic channel that supports microbes using organic carbon (like woodchips and any pumped carbon like acetate) to convert nitrate N into N₂ gas. They usually are connected to a drainage system so that the treated water flows out into a drainage ditch. Wood chip bioreactors are an accessible method to remove 30-98% of nitrate runoff (Roser, 857 & Mark, 825).
1.1 Carbon Dosing Background
Based on past studies, the introduction of other forms of organic carbon into the bioreactor have proven to increase nitrate removal performance. In the paper Carbon Dosing Increases Nitrate Removal Rates in Denitrifying Bioreactors at Low-Temperature High-Flow Conditions, acetate dosing reduced nitrate load by one-third at 5℃ (Roser, 856). This carbon-dosing can help supplement times when the microbes in the bioreactor cannot break down all of the nitrate going through the bioreactor. If there are high flows through the bioreactor, the carbon source from the woodchips are not always enough to break down all of the nitrate moving through the bioreactor. Therefore, we plan to pump more acetate in the bioreactor during these high flow periods to increase the microbe’s metabolism.
Based on Temperature and Substrate Control Woodchip Bioreactor Performance in Reducing Tile Nitrate Loads in East-Central Illinois, some of the significant limiting factors to bioreactor performance is wood chip quality, wood chip age, and temperature. The performance of the bioreactor during the first year far exceeds the following two years of data demonstrating how younger woodchips are a more effective carbon source than older woodchips. Also, their study suggests that there is a strong response to temperature proving that cold temperatures during January through March will cause low denitrification rates.
1.2 Objectives
The objectives for my contribution were: (1) assisting a graduate student, Zihao Zhang, with collecting water samples and analyzing sensor data and system performance; and (2) leading the development of the IoT system, and sensor control system which will enable weather forecasts to control automated and pro-active preparation for high-discharge storm events (e.g., draining the reactor before storms to increase storage volume of storm water).
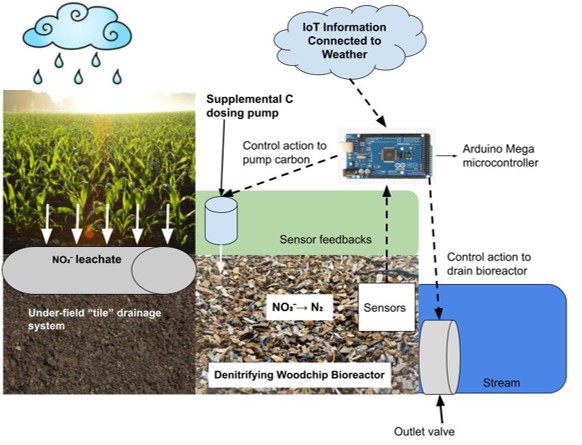
The longterm goals for my contribution to this project is to help enable the system shown in Figure 2. This shows the sensor network connected to the Arduino controller with IoT weather feedback and carbon pumping capabilities.
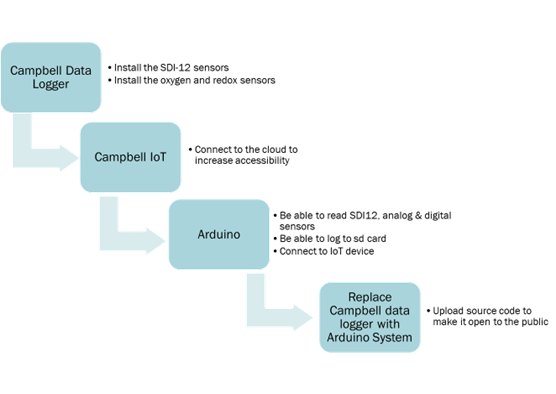
For the first set of tasks, I will be continuing my work from the spring semester in testing, calibrating, and deploying the sensors, and controllable valves as a retrofit to the woodchip bioreactor at Cornell’s Thompson Vegetable Farm. The bioreactor retrofit was fully installed by May 1st so my summer responsibilities included taking water samplings from the site, analyzing data, troubleshooting any issues we have with the equipment and developing the sensor network to be compatible with the Arduino microcontroller. I facilitated the testing and transition from the Campbell Scientific datalogger to the cheaper and more accessible Arduino microcontroller. In addition, I will be leading the development and implementation of the IoT technology that will act as a communication network between the weather forecasting machines at Cornell and the bioreactor. Below, Figure 3 demonstrates the progression of activities. For this paper, I completed every section other than the final replacement of the Campbell data logger with the Arduino system.
2. Materials and Methods
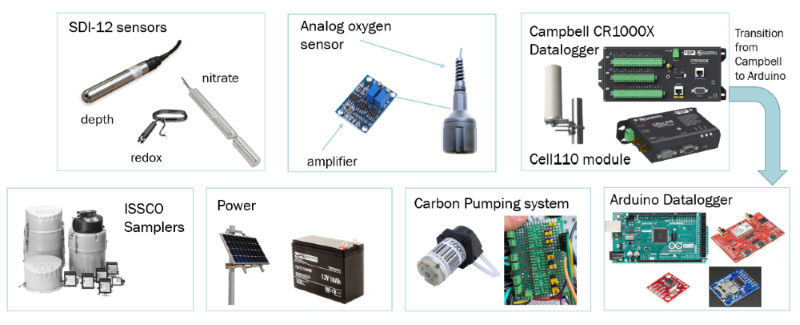
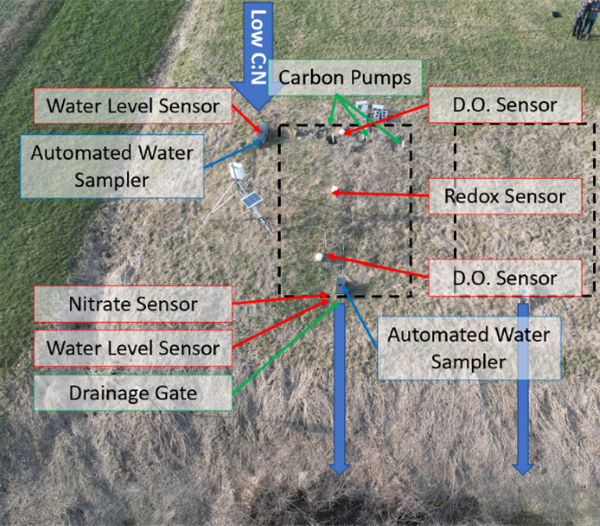
The first objective was to successfully install the Campbell Datalogger supported system. The figure below shows all of the components of this installation process.
2.1 Initial Sensor Installation
The first step was to install the Campbell Scientific CR1000X datalogger. This datalogger would connect the sensors and save the data in one file. To communicate with the datalogger and sensors, we utilized Loggernet software that would collect data every 10 minutes. To power the Campbell datalogger and sensors, we installed a solar panel and 12V battery onto the structure.
Next, we installed the SDI-12 sensors. SDI-12 is an environmental sensor communication protocol that is different from typical digital or analog sensors. The water level sensors, redox sensor and nitrate sensor all used this protocol. We installed a water level sensor in the inlet and outlet of the bioreactor. The inlet and outlet channels are open structures in the beginning and end of the bioreactor that we could place sensors to get an estimate of the conditions of the water before and after going through the bioreactor. The redox sensor monitors the amount of bromide in the bioreactor. It was installed vertically in a PVC pipe in the center of the bioreactor. When we would pump acetate through the bioreactor, we included bromide as an indicator of how well the bacteria was utilizing and breaking down the additional carbon source to break down nitrate. The last SDI-12 sensor we installed was the nitrate sensor. We installed this sensor in the outlet structure. This sensor detected the nitrate levels of the water leaving the bioreactor.
After those installations, we installed the analog dissolved oxygen sensors. We installed one sensor in the beginning of the bioreactor and one at the end of the bioreactor. This sensor measured oxygen levels to see how well the bacteria was breaking down nitrate. When the microbes break down nitrate into nitrogen gas, they release oxygen which was measured by the oxygen sensor.
To gain a better understanding of the nitrate levels moving through the bioreactor, we installed the ISSCO water samplers in the inlet and outlet of the bioreactor. These machines take samples from the bioreactor every 6 hours which we analyzed to determine the amount of nitrate going into and leaving the bioreactor.
Lastly, we installed the carbon pumping system to make it feasible to pump acetate into the inlet portion of the bioreactor. For this system, we installed 6 peristaltic 12V DC pumps and utilized 3 Pololu motor drivers to regulate the pumping. The Pololu motor drivers were able to drive the 5V signal into a 12V signal to power the pumps. This made it feasible to conduct a proof of concept experiment to prove that pumping carbon into the bioreactor would result in an increased breakdown of nitrate.
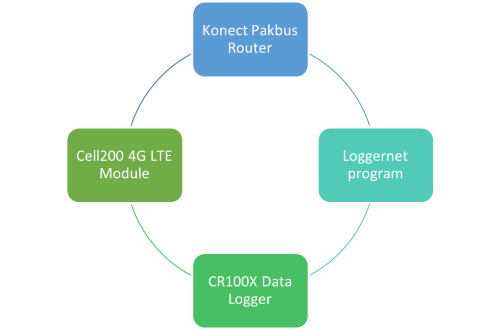
2.2 Campbell Scientific IoT Installation
To add an IoT component to the datalogger, I utilized the Cell200-4G LTE cellular module by Campbell Scientific. To connect this device to the module, I installed an omni-directional antenna to the outside of the storage box. Then, I wired the Cell200 module to the Campbell Scientific datalogger and utilized the online Konect pakbus router to send the Loggernet program to the cell module and then to the datalogger. Utilizing this setup, we could send new programs to the datalogger and save data from the datalogger. The diagram below shows a visual of the connection between all the components.
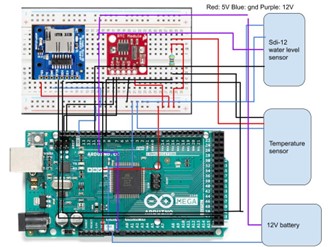
2.3 Arduino Bench Testing
The Arduino bench testing was an important step to test the individual components needed to migrate to the Arduino datalogging system in the lab. The figure below shows one of the final iterations of the bench testing that tested an SDI-12 sensor, temperature (digital) sensor, real-time clock and sd card. In addition, I completed a test of the analog oxygen sensors.
2.3.1 Real-Time Clock
For the real-time clock, I did a system analysis of different programs to see which would take up the smallest amount of storage since the real-time clock is a large use of the Arduino storage. The purpose of focusing on reducing the storage use is that there can be large errors in C++ if your SRAM storage overfills. SRAM is the static random access memory where the sketch creates and manipulates variables when it is running. If this fills up (especially with String variables), it can cause the Arduino to crash or have errors that are difficult to debug. I utilized a program in each of them that would print the unused SRAM, program storage and dynamic memory used. The program that I chose had 957/2560 bytes of unused SRAM, 65% of program storage used, and 57% of dynamic memory used with the Pololu A-Star 32U4 microcontroller.
2.3.2 Memory Storage
For the memory storage component of the system, I utilized an SD card reader with the system. The issue I encountered with the SD card reader was that it would stop recording data after a couple hours inexplicably. My hypothesis for why this was happening was that the String class in Arduino was draining the SRAM storage by creating a new instance of a String each time it ran through the loop to save a new value to the excel spreadsheet on the SD card until the SRAM =0. To fix this issue, I rewrote our code for the SDI-12 sensor and digital sensor to not have any Strings and to reduce any variations in the SRAM storage as the program ran. To replace the String variable, I utilized chars which is a more dynamic version of the String variable for C++. Once I finished this alteration, I was able to get a steady SRAM value so it became clear that the SRAM was not an issue anymore.
I also changed the internal SD card reader on the Pololu A-star 32U4 to an external SD card reader connected to an Arduino mega. In this change, I also changed the brand of SD card. I made this change because it was unclear if the Pololu A-star 32U4 was supplying a constant 5V to power the SD card. I suspected that the internal SD card could have not been supplying enough power to it causing it to stop logging data at a random interval. This final change with the updated code helped the SD card log data for a whole weekend.
2.3.3 SDI-12 Sensor Connection
For the SDI-12 connection, I utilized the open-source library for SDI-12 sensors (Damiano). The open-source library was helpful to utilize the build-in SDI-12 specific functions but I had to rewrite the code to utilize that with the real-time clock, sd card and other sensors. In addition, I edited it to not have any Strings as mentioned above.
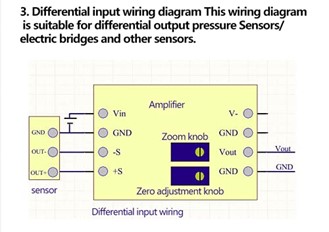
2.3.4 Analog Sensor Connection
For the analog sensor connection (Oxygen sensor), I utilized a boost converter chip. The oxygen sensor had an output of 33 mV +/- 9 mV when fully saturated and less than 2 mV when there was zero saturation. I needed the boost converter chip because the oxygen sensor’s output values were too small for the Arduino to read. The oxygen sensor wiring utilized a differential input wiring so the diagram below demonstrates how I connected it. Then, I calibrated it with the zero knob and then zoomed in until I was getting outputs that were out of 1023 bins.
Miscellaneous Lessons Learned
One of the main issues I ran into was that boards would stop working randomly. Once it happened a couple times, I investigated further. Since I was using a Pololu A-Star 32U4 for my initial testing, I found that if I was using a 12V input I needed to connect it to a separate component where it says :Power in” seen in the figure below instead of the pink Vin switch.
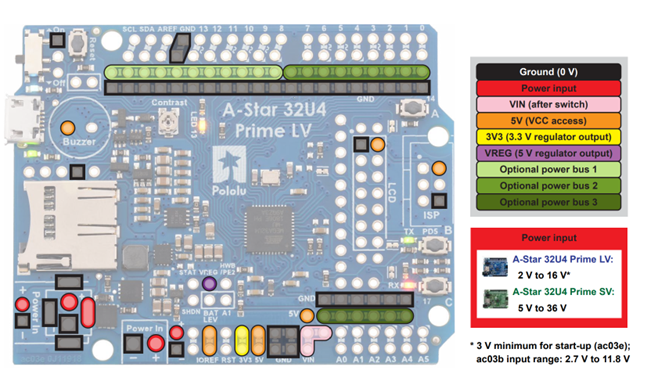
I installed a screw-in terminal to connect the battery in the power in port. In addition, I localized the issue to frying the Texas Instruments Autoswitching power mux (TPS2112A). This mux helps regulate and choose what power supply to utilize between the USB cable and battery. Our theory was that when the Pololu was connected to both the USB cable and battery and there was a power surge on either of the sources, it would break that mux and fry the board. In addition, if the power regulator within the Texas Instruments chip gets fried because the input of 2.8V to 5.5V gets pushed to GND it would break this important chip and make the Pololu unable to send a program over the USB when connected to the battery and USB. To prevent this from happening again, I changed the setup to a male-female connector cord that could be unpluged when making changes to the device configuration to reduce overpowering the board.
3. Results
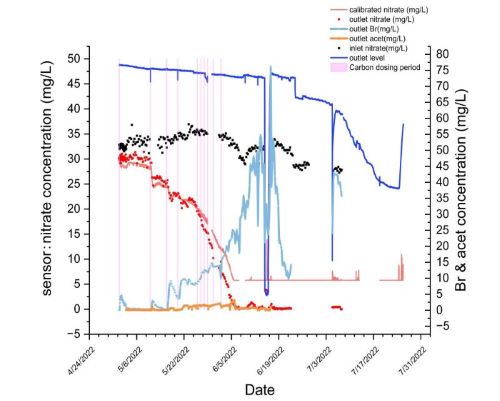
Figure 10 demonstrates the nitrate concentration from our sensor network from 4/29/2022 to 7/31/2022. The orange line is the calibrated nitrate concentration at the outlet measured by the nitrate sensor. The black dots represent the nitrate spot measurements from the inlet and the red dots represent the nitrate spot measurements from the outlet. The light pink lines demonstrate when carbon dosing occurred in the system. In the second carbon dosing we did, there was a sharp decrease in the outlet nitrate levels which demonstrates a proof of concept that carbon dosing is effective in our bioreactor. Also, the inlet nitrate levels remained high during that period demonstrating that there was nitrate coming into the system that was effectively being broken down. We then completed carbon dosing in shorter intervals which was also effective but didn’t result in as large of a decrease as we hoped. Between June 10th-19th, we drained the bioreactor since it was at low flow and we were preparing for more storm conditions. This resulted in an increase in outlet Br (light blue) which was used as an indicator of our carbon solution therefore some of our acetate solution had gotten stuck in the bioreactor and hadn’t fully flushed through. To counteract this in our next iteration of carbon pumping, we will flush water after the acetate to help it move through the bioreactor. By July, we had significantly lower flows then was effective for the bioreactor system as is seen by the dark blue line showing outlet water level. Therefore, we stopped carbon dosing and additional spot measurements since there was not a lot of new nitrate or runoff coming into the bioreactor.
5. Conclusions & Future Plans
Although we made a lot of important discoveries through the semester and summer, this is only the beginning of the plan for this project. The long-term vision for this research is to create a flexible blueprint for implementing IoT and real-time control methods in woodchip bioreactors to facilitate the uptake of these technological innovations among farmers. Although we have begun integrating the Arduino technology into our project to make it more cost-effective, we hope to replace the main Campbell Scientific CR100X controller with a Pololu 32U4 SV which reduces the cost significantly. In addition, I hope to integrate an IoT module with the Pololu board to make it more accessible and so we can make real time changes to the bioreactor from our lab.
I hope to help setup a open-source guide that would include the code, instruments, wiring and instructions on how to setup your own retrofitted bioreactor. The easy implementation of this emerging technology would help limit the export of high concentrations of reactive N to groundwater and surface water ecosystems, thereby reducing negative effects of overnitrification.
We also are going to be working on determining what variables help increase rate of denitrification the most. In doing this, we will likely conduct lab experiments with different carbon sources, temperatures and pHs to determine what balance creates the optimal environment to regulate for.
I will be continuing this research during the school year thanks to the SRC URP scholars program. This is a program run by Intel, IBM and Texas Instruments to fund research endeavours for students in electrical engineering.
6. Acknowledgements
I am very thankful for the funding and guidance d by the Cornell University Louis Stokes’ Alliance for Minority Participation (LSAMP), a National Science Foundation supported program under Grant No. 06-552, and by the Cornell Institute for Digital Agriculture.
By participating in this project, I was able to dive deeper into digital agriculture as it applies to a functioning farm while gaining necessary research experience to open opportunities for future digital agriculture internships. Being funded for this project allowed me to continue exploring what I have found most interesting in my studies and past job experience: utilizing electronics to develop solutions to environmental challenges. This summer research allowed me to deepen my experience with both ECE and EnvE interests while gaining experience in IoT which will be a valuable technical skill in a wide range of future pursuits in research or industry. The summer experience helped me explore academic college-level research in the intersection between ECE and EnVE. This opportunity helped me decide to major in Electrical and Computer Engineering because there is a focus in that major on outisde of ECE tech electives where I can take environmental technology and sensor classes. It also helped me decide to seriously consider a minor in CALS (likely the community food systems minor) to supplement my engineering coursework.
7. References
[1] EPA. “Nitrous Oxide Emissions.” EPA, United States Environmental Protection Agency, Environmental Protection Agency, article
[2] Roser, Marta B., et al. “Carbon Dosing Increases Nitrate Removal Rates in Denitrifying Bioreactors at Low-Temperature High-Flow Conditions.” Journal of Environmental Quality, vol. 47, no. 4, 2018, pp. 856–864., article
[3] Tian, Linlin, et al. “A Review of Indirect N2O Emission Factors from Agricultural Nitrogen Leaching and Runoff to Update of the Default IPCC Values.” Environmental Pollution, vol. 245, 2019, pp. 300–306., article
[4] Damiano. Sara, Arduino DIY/Arduino SDI-12, (2017), GitHub repository, article